
Guildford's average home reached £532,917 in July, up £6,748 on June and the dearest since November. The annual fall narrowed from 5.2% to 2.2%. Surrey ranked.
The average home in Guildford borough sold for £532,917 in July, up £6,748 on June. That is a rise of 1.3% in a single month, the second monthly rise in a row after June’s 0.6%, and the highest monthly average the borough has recorded since November 2025.
It also changes the shape of the story we have been reporting all summer. Guildford’s annual fall has been among the steepest in England for months. In July it is not.
The figures come from the UK House Price Index, published by HM Land Registry on 16 September. It is built from completed sales rather than asking prices, and it is a mean average, not a median, so a handful of large sales can pull it about.
The annual fall has more than halved
Measured against July last year, the borough is still down. The average is £12,038 lower than the £544,955 of July 2025, a fall of 2.2%.
But that 2.2% follows two much worse readings:
- May 2026: down 5.4% on the year
- June 2026: down 5.2%
- July 2026: down 2.2%
The national comparison moves with it. Of the 295 local authority districts in England, Guildford now has the 35th steepest annual fall, and 85 districts fell. A month earlier it sat 11th. We calculated both rankings from the Land Registry’s full index file, which carries every district for every month.
One correction to our own reporting. When June’s figure was first published we reported it as £523,974, a fall of 5.6%, and ninth steepest in England. The Land Registry has since revised June up to £526,169, a fall of 5.2%, which moves it to 11th. Revisions to the two most recent months are routine in this index.
Still £22,352 below the peak
July was not a return to the top. The borough’s record month is June 2025, at £555,269, the highest in a series that runs back to January 1995. July 2026 is £22,352 below it.
By property type, the picture in July was:
| Type | July 2026 | Change on a year |
|---|---|---|
| Detached | £957,291 | -2.1% |
| Semi-detached | £524,961 | -1.1% |
| Terraced | £430,810 | -1.7% |
| Flat | £269,364 | -5.1% |
| First-time buyer average | £392,308 | -2.2% |
Flats remain the weak point, and have been the drag on the borough average all year. Even so, the flat market is recovering with everything else: the annual fall in flat prices was 8.3% in May, 7.2% in June and 5.1% in July.
Where Guildford sits in Surrey
Guildford is the fifth dearest of Surrey’s eleven districts, and has the fourth steepest annual fall. Five Surrey districts rose over the year and six fell.
| District | July 2026 average | Change on a year |
|---|---|---|
| Surrey Heath | £457,988 | +4.0% |
| Mole Valley | £555,858 | +2.4% |
| Epsom and Ewell | £568,214 | +2.0% |
| Elmbridge | £748,080 | +1.9% |
| Runnymede | £477,182 | +1.1% |
| Woking | £439,916 | -0.3% |
| Reigate and Banstead | £480,824 | -0.4% |
| Guildford | £532,917 | -2.2% |
| Waverley | £553,429 | -2.6% |
| Spelthorne | £439,609 | -2.9% |
| Tandridge | £482,599 | -5.0% |
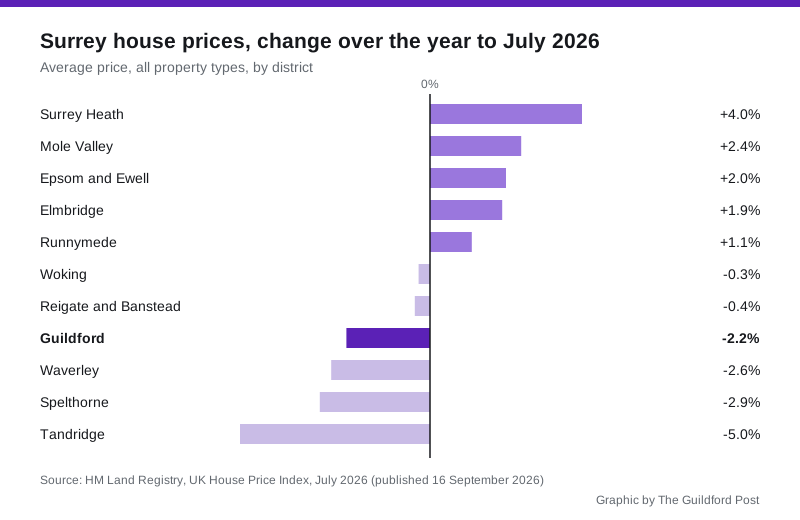
Surrey as a county averaged £522,523 in July, down 0.4% on the year. The South East was up 0.2% at £380,878, and England was up 1.1% at £293,479. Guildford is therefore still falling while the country as a whole is rising, but by far less than it was.
The figure nobody can see yet: how many homes are selling
Sales volumes lag the price data by about two months, so the most recent count published for Guildford is May 2026, at 108 sales. That compares with 113 in May 2025. June and July are not yet published.
Any comparison with spring 2025 needs a warning attached. The stamp duty threshold changed on 1 April 2025, and Guildford recorded 342 sales in March 2025 and 74 in April 2025 as buyers rushed to complete. Those two months are not a normal baseline for anything.
What it means for you
- If you are selling, July is the first month in a while when the recent trend helps rather than hurts. Two consecutive monthly rises do not make a recovery, and the average is still below where it was a year ago.
- If you are buying, the borough average is £22,352 off its 2025 peak, and flats are 5.1% cheaper than a year ago. Flats have fallen furthest and longest of any type here.
- Do not price a specific home off this number. It is a borough-wide mean across Guildford town, Ash, the Horsleys, Shere, Ripley, Send and everywhere between. Our Guildford house prices page keeps the current figures and explains what the index does and does not measure.
- Your council tax band is not affected. Bands come from 1991 values, not current prices, and are set out on our Guildford council tax bands page.
Sources: UK House Price Index, Guildford, HM Land Registry, July 2026 data published 16 September 2026; UK HPI full file for July 2026, used for the district rankings and the Surrey comparison. Contains HM Land Registry data (Crown copyright), licensed under the Open Government Licence v3.0.
Have your say