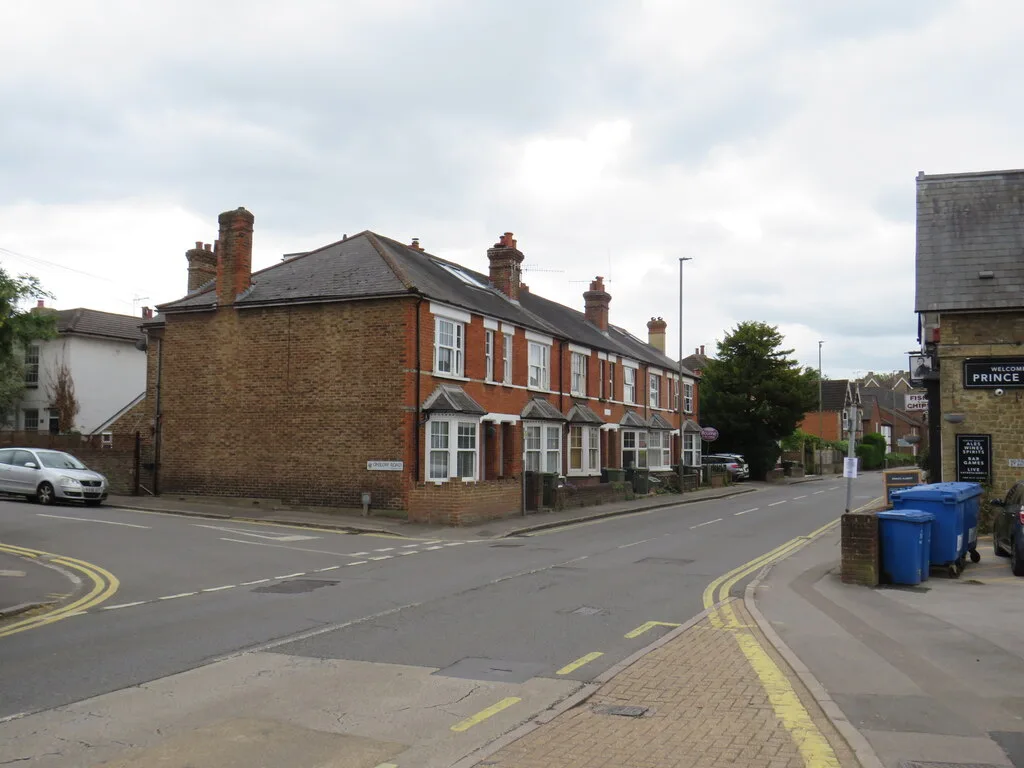

The borough average fell £31,295 to £523,974 in the year to June, the ninth steepest drop of 295 English districts. Prices by type, and Surrey compared.
The average home in Guildford borough sold for £523,974 in June 2026, down £31,295 on a year earlier. That is a fall of 5.6%, and it is one of the steepest in the country: of the 295 local authority districts in England, only eight fell further, and seven of those eight are London boroughs.
The figures come from the UK House Price Index, published by HM Land Registry on 19 August. It is built from completed sales, not asking prices.
The number behind the number: June 2025 was the peak
June 2025 was not an ordinary starting point. At £555,269 it was the highest monthly average the borough has ever recorded, in a series that runs back to 1995. Guildford has spent the twelve months since coming off that high, falling in seven of them.
So the 5.6% is not a dip from a normal level. It is the distance back from the top.
June itself was actually a small up month. The average rose 0.9% on May, after May fell 2.4%. One month is not a turn, but it is worth noting the fall is not accelerating.
Where Guildford sits in England
Across England, prices rose 1.8% over the same twelve months, to an average of £293,262. Only 62 of the 295 English districts fell at all.
Guildford’s 5.6% fall is the ninth largest. The eight bigger ones are:
- City of Westminster, down 25.4%
- City of London, down 20.4%
- Kensington and Chelsea, down 14.7%
- Hammersmith and Fulham, down 13.3%
- Tower Hamlets, down 13.1%
- Islington, down 8.1%
- Camden, down 7.1%
- South Hams in Devon, down 6.8%
Seven London boroughs and one Devon district. Guildford is the only place in the top nine that is neither.
Surrey is not moving as one
The county as a whole fell just 1.2%. Guildford is well outside that average, and so is the district next door in the other direction.
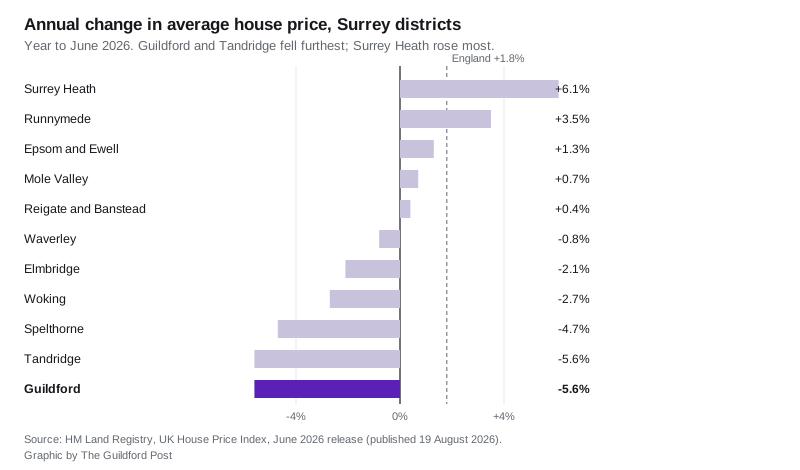
Guildford and Tandridge share the steepest fall in Surrey, both at 5.6%, with Guildford a fraction ahead on the unrounded figures. At the other end, Surrey Heath rose 6.1% and Runnymede rose 3.5%. Camberley and Chertsey are the same commuter belt as Guildford, on similar journey times, moving in the opposite direction.
The nearest comparison of all is Waverley, immediately south. It fell only 0.8%, to £560,596. Waverley has been the dearer of the two in every month since January 2021, but the gap is now £36,622, having been £9,775 a year ago.
What you pay by property type
Every category fell, and flats fell hardest:
| Property type | Average, June 2026 | Change on the year |
|---|---|---|
| Detached | £939,146 | down 6.4% |
| Semi-detached | £516,215 | down 4.4% |
| Terraced | £422,733 | down 4.8% |
| Flat or maisonette | £266,513 | down 7.3% |
| All property types | £523,974 | down 5.6% |
A first-time buyer in the borough paid an average of £386,036, down 5.3%. Someone selling one home to buy another paid £669,685, down 5.9%.
Fewer sales, and a distorted comparison
The Land Registry does not publish a sales count for the two most recent months, because late registrations are still arriving. The latest published figure is April 2026: 101 sales.
For the first four months of the year, the borough recorded 473 sales in 2026 against 753 in 2025. That gap looks dramatic and it should be treated carefully. The stamp duty threshold changed on 1 April 2025, and buyers rushed to complete before it. Guildford recorded 342 sales in March 2025 and 74 in April 2025, either side of the change. The 2026 months are far steadier: 113, 122, 137 and 101.
A correction: May’s figure has been revised
When the May data was first published, the borough average was given as £522,008, a fall of 5.6%. The June release revises May down to £519,163, a fall of 6.1%.
Revisions like this are routine. Every month’s figure is provisional and settles as late sales are registered. We had published the original May figure on our Guildford house prices page, which has now been updated to June.
What it means for you
If you are selling. The borough average is £31,295 below where it was a year ago, and that year-ago figure was an all-time high. Pricing off what a neighbour achieved in mid-2025 is pricing off the peak. Flats are the most exposed: a 7.3% fall is roughly £21,000 off the average flat.
If you are buying. Apart from May this year, the last month in which the borough average sat below today’s £523,974 was July 2024. A first-time buyer average of £386,036 is £21,556 below last June. Mortgage costs, not prices, will decide whether that helps you.
If you are neither. Council tax bands do not move with prices. They are still based on what a property was worth on 1 April 1991, which is why a falling market does not cut your bill. Our Guildford council tax bands page sets out the current charges.
One caveat to carry through all of it. The UK House Price Index average is a mean, not a median. A handful of very large sales pull it upward, and the borough runs from town-centre flats to houses in the Horsleys and Shere. It measures the borough, not your street.
Sources
- HM Land Registry, UK House Price Index: Guildford, June 2026 release, published 19 August 2026
- UK HPI full data file, June 2026, used for the England-wide ranking and the Surrey comparison
- UK HPI full data file, May 2026, used for the revision to May
Have your say